Your A/B Test Probably Did Not Prove Anything
Small sites run tests that cannot possibly detect the effect they are looking for, then stop them the moment the graph looks good. Both habits manufacture results that vanish in production.
The test that made the button green
A company tests two versions of a landing page. After four days the new one is 31% ahead. Somebody screenshots the dashboard, the change ships, and the quarterly report claims a 31% conversion lift.
The following quarter, conversion is flat. Nobody revisits the claim, because by then there are three other changes to credit or blame.
This happens constantly, and it is not caused by bad tools. It is caused by two specific statistical mistakes that almost every small team makes.
Mistake one: stopping when it looks good
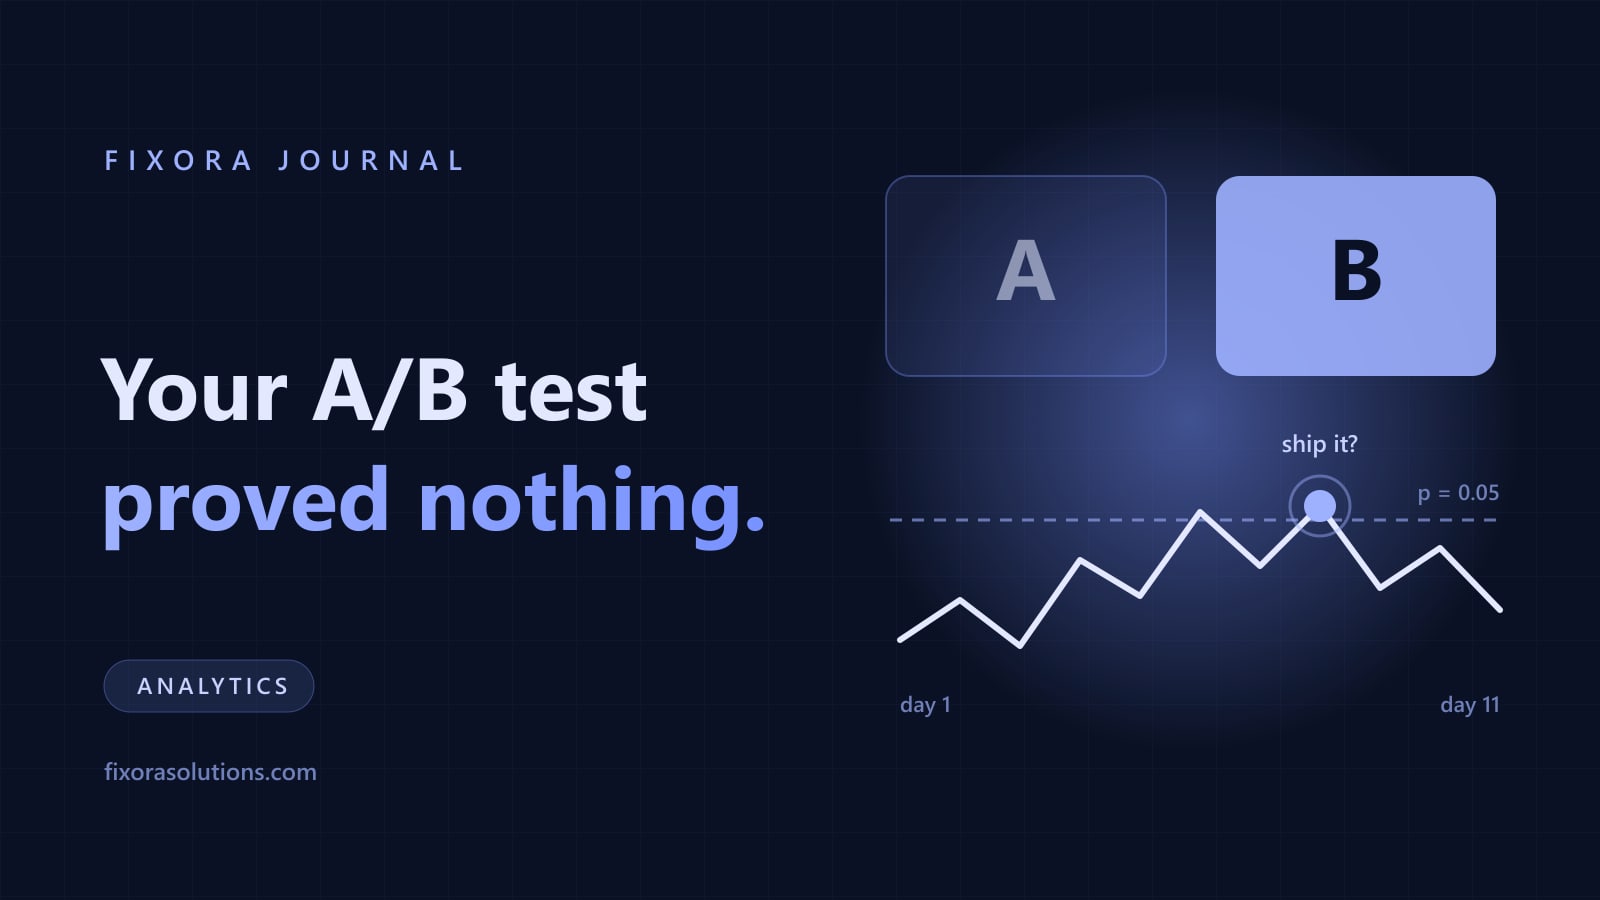
A/B testing maths assumes you picked a sample size in advance and looked once, at the end. Checking the dashboard daily and stopping the moment significance appears breaks that assumption completely.
Evan Miller's How Not to Run an A/B Test puts numbers on it. In his worked example, a stopping rule of "end the test when it hits 5% significance" produces a real false positive rate of 26.1%, more than five times what the experimenter thinks they are accepting. Peek ten times and what you read as 1% significance is really about 5%.
Random noise wanders. Given enough looks, it will wander across your threshold at some point, and that is the moment you are most likely to call it a win.
The fix is free: decide the sample size and the end date before you start, then do not act on the result until you reach it. Look if you cannot resist. Just do not stop.
Mistake two: testing an effect you cannot see
The second problem is arithmetic and it is worse, because it makes the test pointless before it begins.
The smaller the effect you want to detect, the more traffic you need. Detecting a change from 2% to 3% conversion at conventional confidence needs on the order of a few thousand visitors per variant. Detecting 2% to 2.2% needs tens of thousands.
Now put your real numbers in. If your landing page gets 600 visits a month and converts at 3%, that is 18 conversions. You cannot detect anything short of a change that doubles performance, and a change that doubles performance is not a button colour.
Running the test anyway is not neutral. It produces a number, the number gets believed, and you have paid for a decision made on noise. That is the same failure mode as judging a campaign on an attribution window it cannot survive.
What to do when you do not have the traffic
Most small businesses do not have the volume for meaningful A/B testing. This is not a reason to guess. It is a reason to use instruments that work at low volume.
- Ship the changes with a known direction. Faster pages, clearer headlines, fewer form fields, visible pricing, real proof. These are supported by large bodies of research across many sites. You do not need to re-derive them on your 600 visitors.
- Test big swings, not refinements. A different offer or a different page structure can produce an effect large enough to see. A shade of blue cannot.
- Watch behaviour, not just outcomes. Five session recordings and a scroll map will tell you more about why a page fails than a significance calculator will, and they work at any sample size. So will ten customer interviews.
- Use before and after, honestly. Compare 30 days to 30 days, note the confound of seasonality and campaigns, and describe it as evidence rather than proof. Stated that way it is useful and defensible.
- Pool your evidence over time. A page that improved after three separate changes across a year, with traffic mix roughly constant, is a real signal even without a control group.
The honesty part
If you report a lift you cannot support, you are borrowing credibility against a future quarter that has to repay it. Internally it corrupts the roadmap. Externally, in a case study, it is a claim that falls apart under one question from a sceptical buyer, which is exactly what claims that survive scrutiny are for.
The most useful sentence in a marketing report is often "we changed this, the number moved, and we cannot yet separate it from seasonality." It sounds weak. It is the only version that stays true.
Frequently asked
How long should a test run? Full weeks, always, and at least two of them, because weekday and weekend behaviour differ. Then to the sample size you set at the start.
Is Bayesian testing a way around this? It reframes the question usefully, but it does not conjure information out of low traffic. Underpowered is underpowered.
Can Fixora tell us if a test is worth running? Yes: your traffic, your conversion rate, and the effect size you would need, before you spend a month on it. Send us the page and get the numbers within 48 hours.
Have a project that needs this?
Tell us what you are building. We reply within 24 hours.
The service behind this
AI Marketing Services
A full marketing function without the headcount: strategy, content, campaigns, and outbound, run as one system and reported on the numbers that decide whether it paid.